In this post, I explore and analyze some e-commerce customer data by identifying patterns in customer satisfaction and churn.
The dataset used for this analysis includes information on customer demographics, purchasing behavior, and satisfaction scores. Key features include:
- CustomerID
Unique identifier for each customer. - Gender
Gender of the customer (Male/Female). - MaritalStatus
Marital status of the customer (Married/Single/Divorced). - PreferedOrderCat
Preferred order category of the customer (e.g., Fashion, Grocery, Mobile). - SatisfactionScore
Satisfaction score given by the customer (1 to 5). - Complain
Whether the customer has made a complaint (Yes/No). - Churn
Whether the customer has churned (0 for no, 1 for yes).
Key Analyses and Insights
Who are the customers?
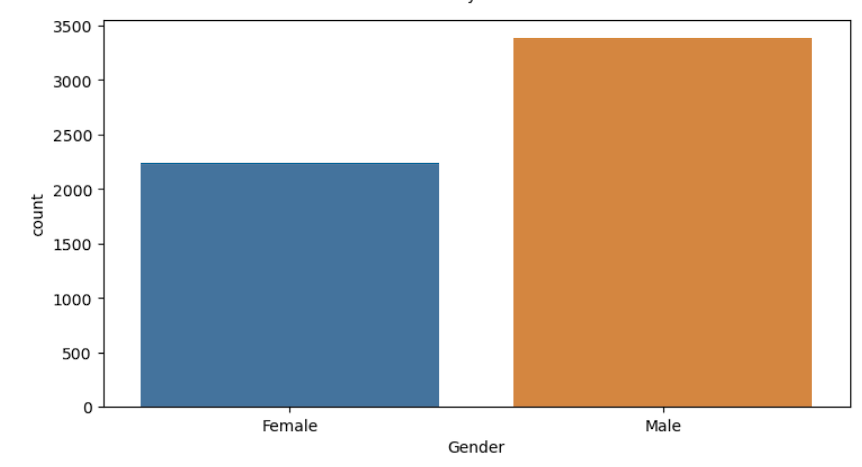
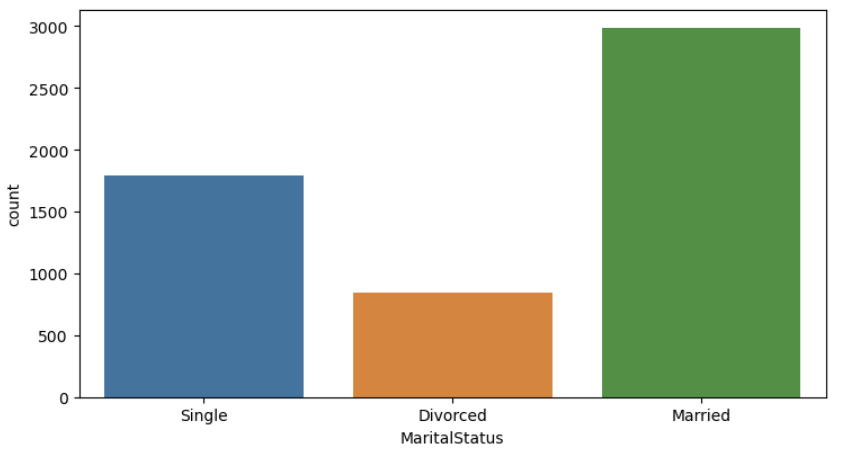
I start off by getting the gender and marital status distribution and found:
Male: 3384
Female: 2246
Married: 2986
Single: 1796
Divorced: 848
The customer base is predominantly male, with males making up 60% and females 40% of the total customer population.
Discovering Preferred Order Categories
I examine customer preferences by analyzing preferred order categories
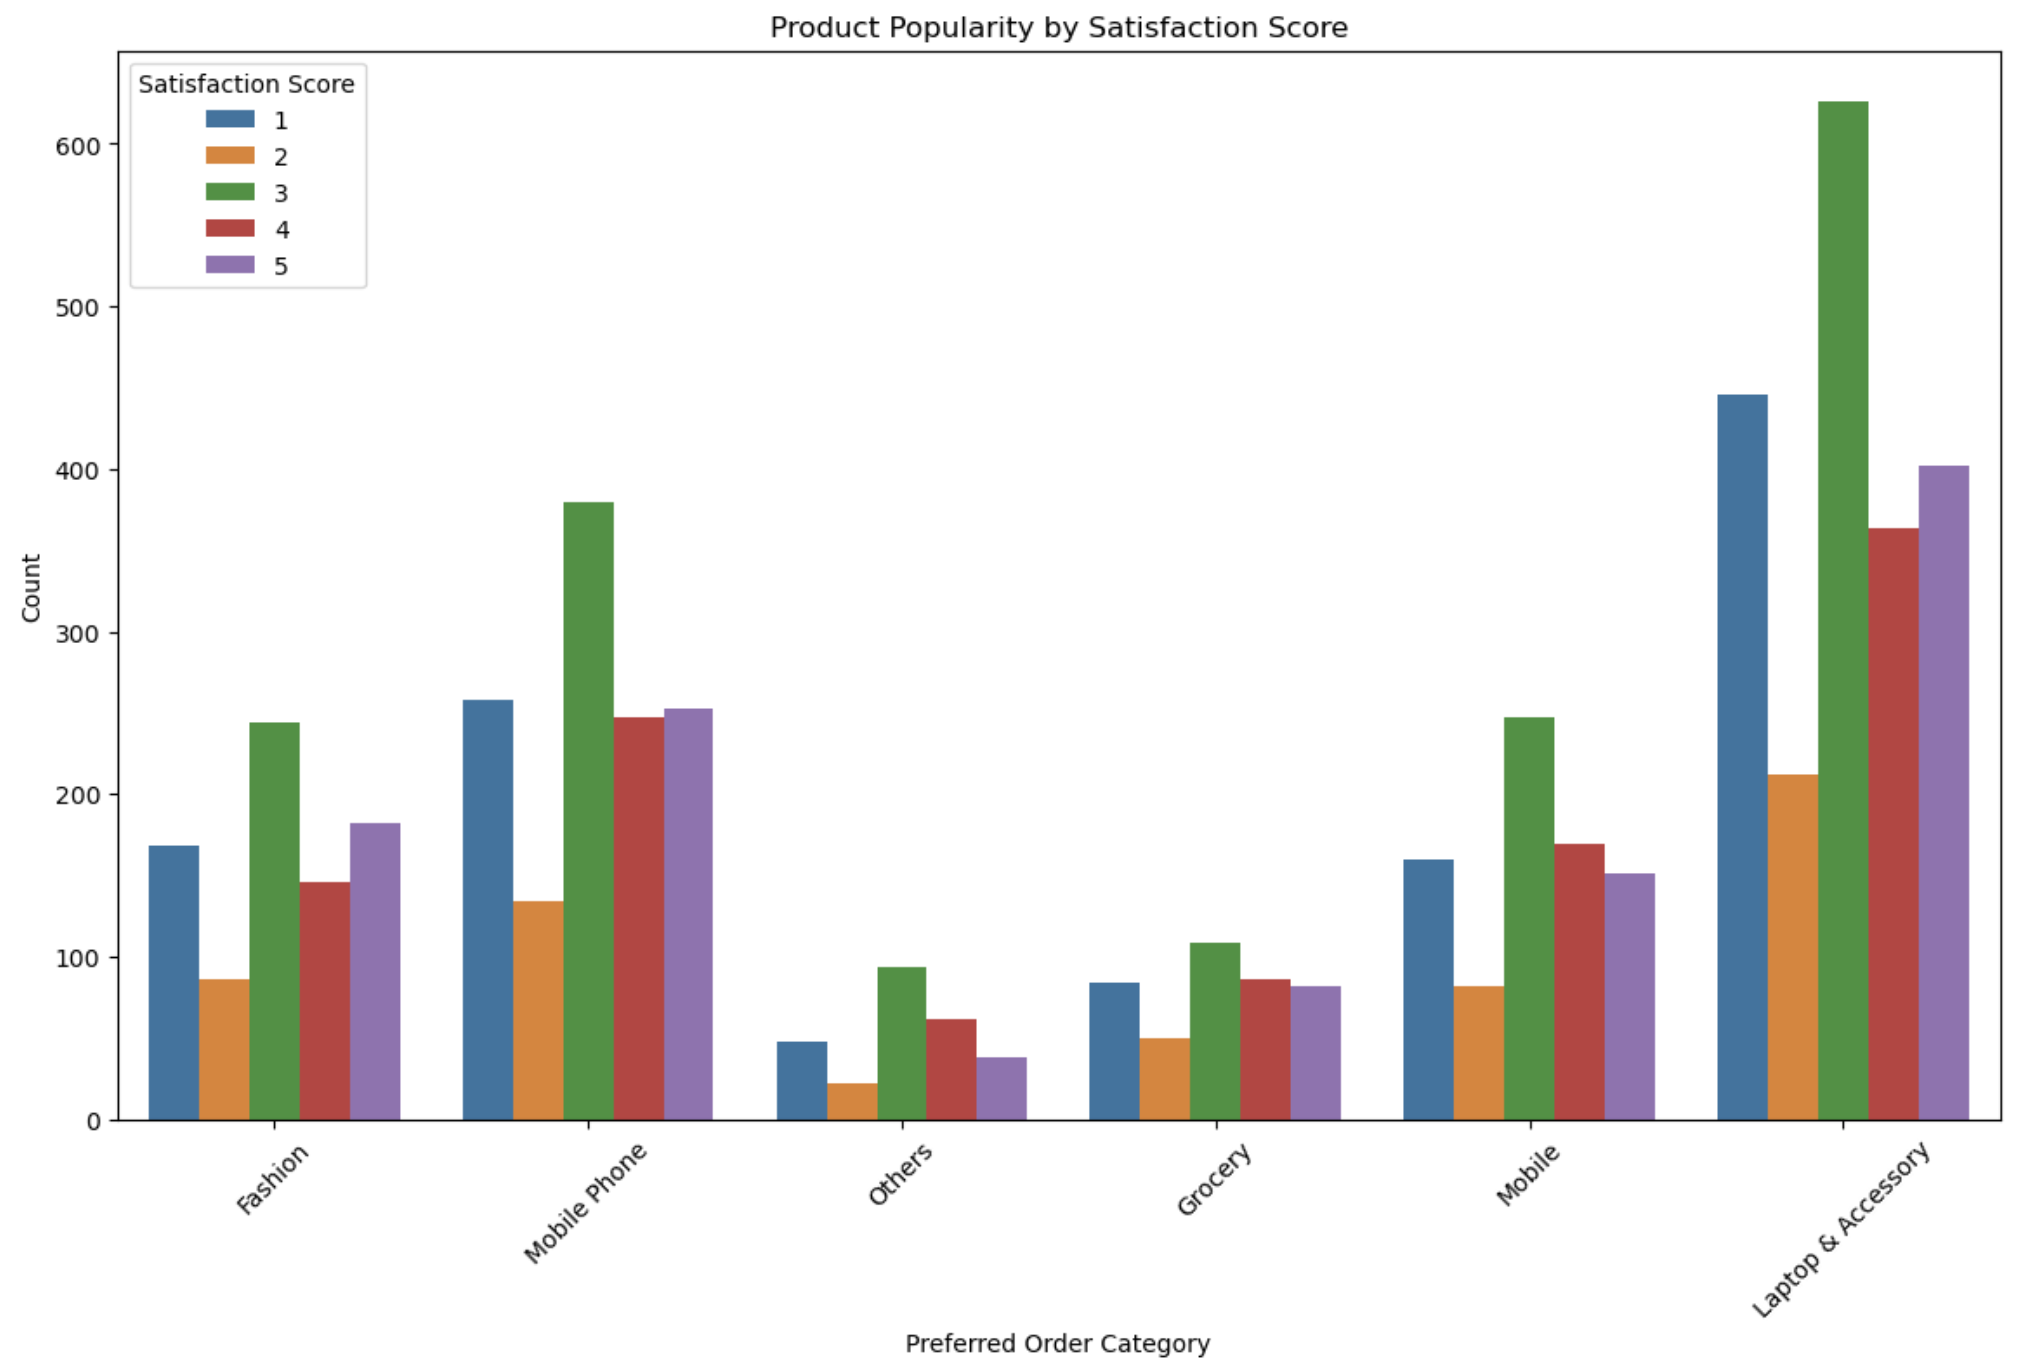
Categories like “Mobile Phone” and “Laptop & Accessory” have the highest satisfaction scores, indicating that these product categories are highly favored by customers.
I also explore the relationship between marital status and preferred order categories to understand how different demographic groups shop.
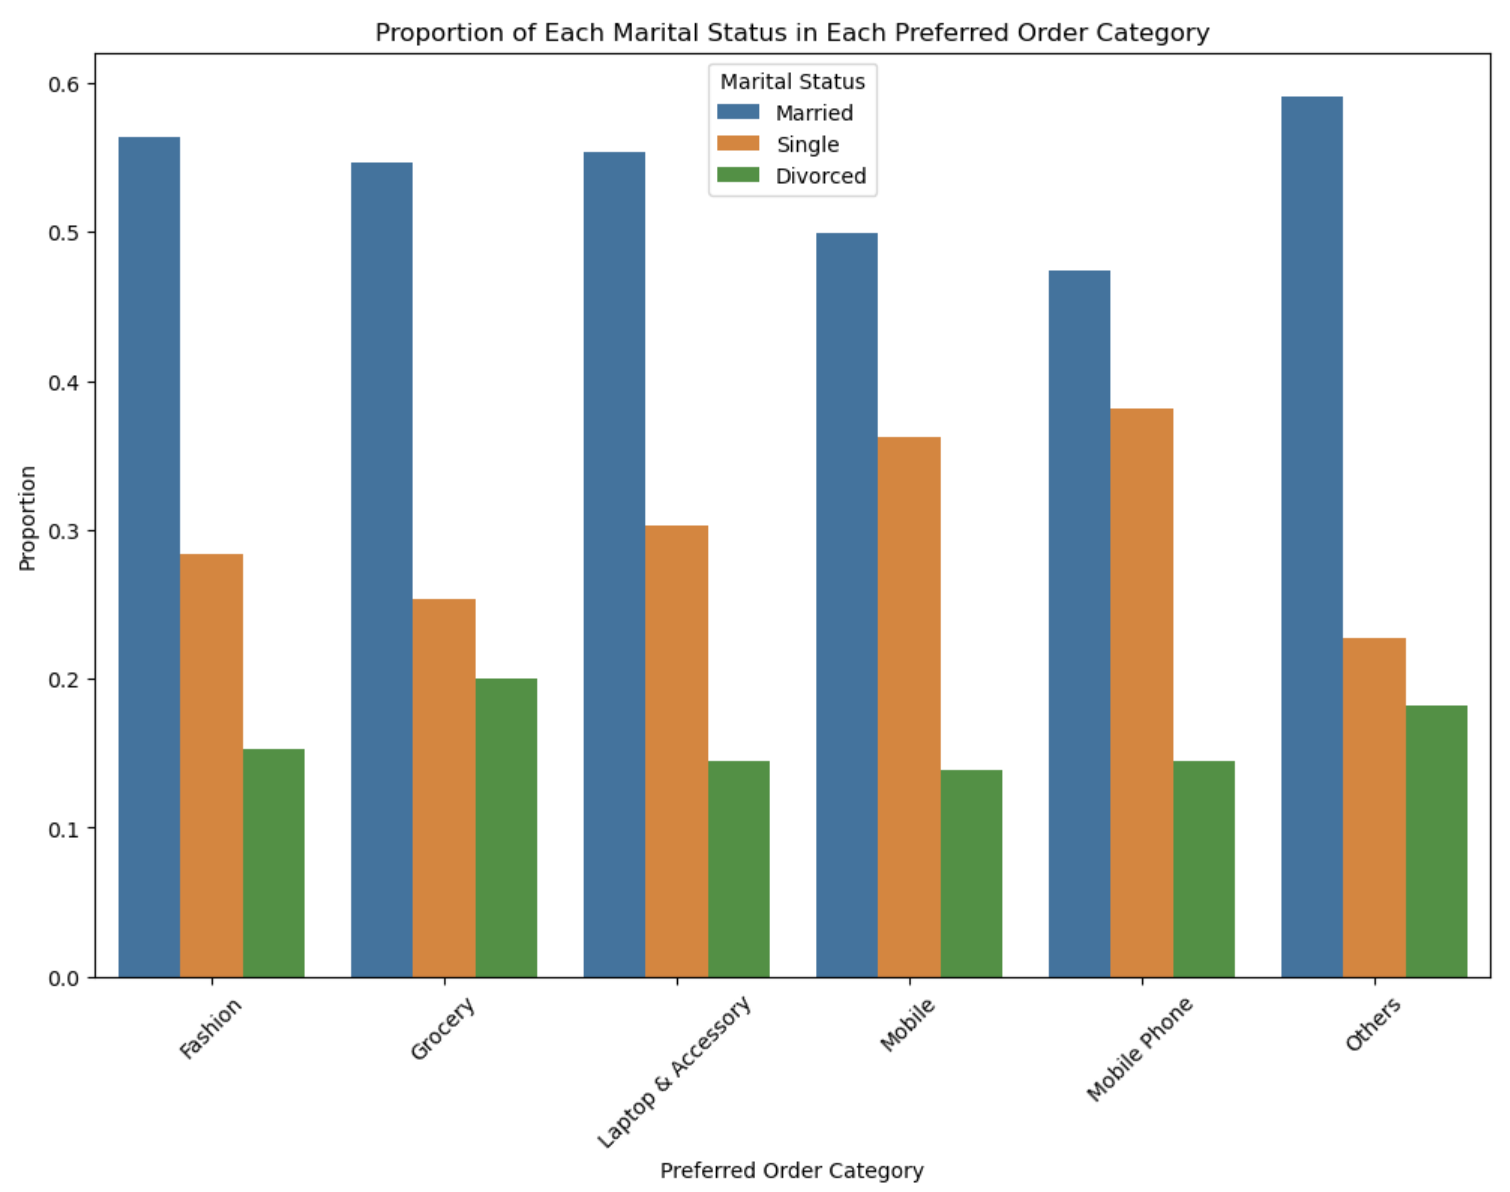
General Observations
Dominance of Married Customers:
Across all product categories, married customers consistently show higher numbers compared to single and divorced customers. This indicates that married individuals might have a higher purchasing power or different shopping needs compared to other groups.
Single Customers:
Single customers generally follow married customers in numbers, with a considerable gap in categories like Laptop & Accessory and Mobile.
Divorced Customers:
Divorced customers consistently form the smallest group in all categories. This might reflect different shopping habits or economic conditions impacting their purchasing behavior.